Ah, the 1990s. They seem like idyllic times now. The Berlin Wall had fallen, opening up much of the world to newfound freedom. America’s tech boom was in full flower. The music scene exploded with creativity, as alternative, hip hop, and grunge became household words. And in the world of alcohol beverages, beer was on a roll, gaining share from spirits and wine each and every year.
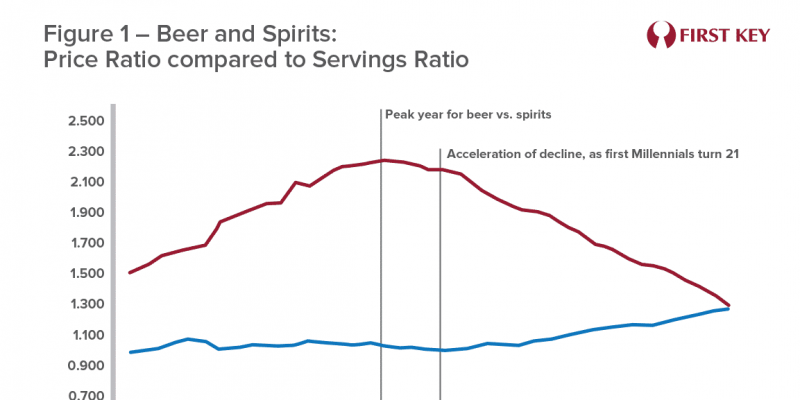
That last point may seem a little mundane compared to the first three, but not if you’re in the beer business. We all know what happened next: beer’s upward trajectory peaked around 1997. In that year Americans drank 2 ¼ beers for every serving of distilled spirits they consumed. Since then, beer’s proportion of the total has been declining, as Figure 1 shows. (We’re leaving wine out of the discussion for the sake of simplicity.)
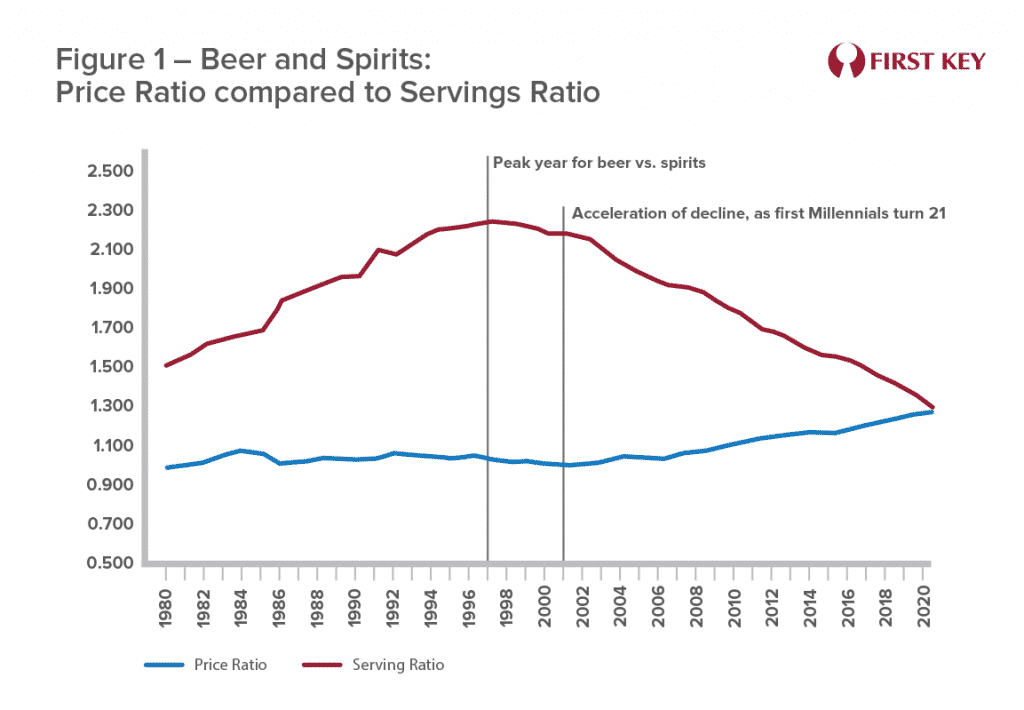
Consumer preferences have clearly shifted. Of that there is no doubt. And when Millennials began turning 21 in the early 2000s, the shift began to accelerate as that generation began asserting its own preferences for spirits. But discussions of this seismic shift may not appreciate the role of something more basic when it comes to changes in consumer demand: pricing.
An analysis of the Consumer Price Indices for Beer and for Distilled Spirits yields at least two interesting perspectives on the shifting fortunes of the two categories. First, in the 1980s and 1990s, the beer category was able to raise prices relative to spirits and yet still keep growing its advantage in terms of sales.[1] This is a measure of beer category equity.
Second, since the beginning of the 21st century there is a strong and consistent mathematical relationship between the price ratio and the servings ratio – an inverse relationship, meaning as the price increases the demand (servings) decline, as we might expect given basic economics. In fact, the beer category has continuously increased its price relative to spirits even in the face of declining share – possibly not intentionally, since the increase in beer prices over the last two decades have been somewhat modest, while the spirits category has essentially held the line on pricing over that period.[2] Yet this raises the question of whether we should identify shifting consumer preferences as the only culprit, when spirits’ pricing strategy may well have been an accessory.
Figure 2 uses the same data as Figure 1, but rather than show the ups and downs of each variable over time, it maps one against the other in a cross-sectional analysis. So, for example, starting at the bottom left, the data point labeled 1980 portrays the ratio of the two price indices (100) and the ratio of beer servings to spirits servings (1.519) for that year.
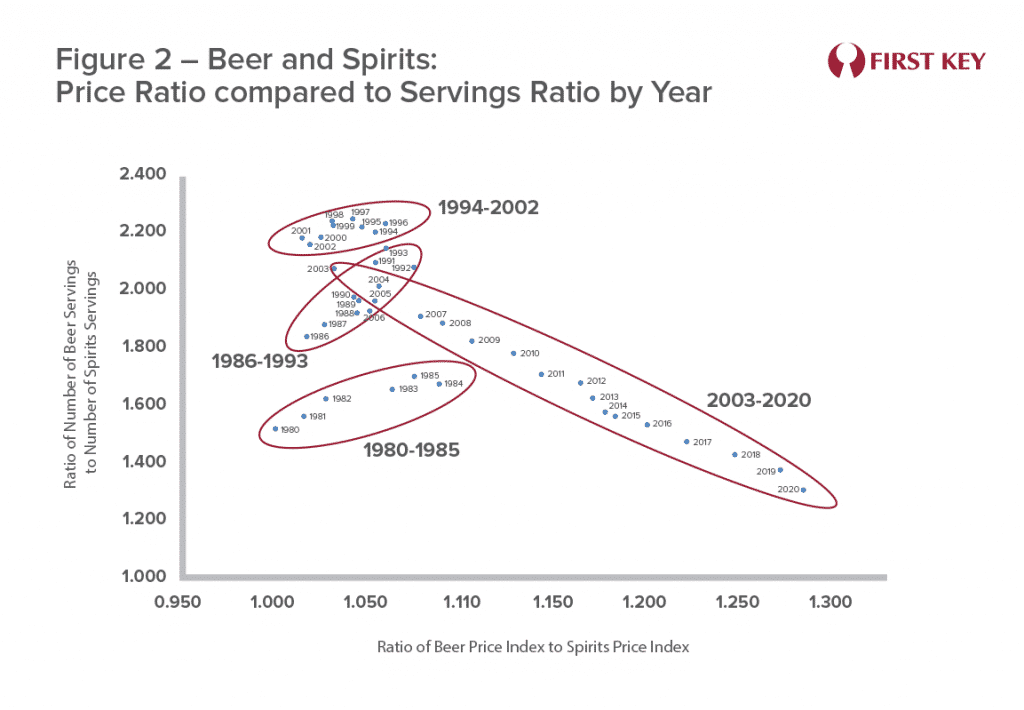
The data points fall into four different clusters, which tell of shifting dynamics over time:
- The 1980-1985 cluster: beer is able to continue growing its proportion of servings even as it raises prices, year by year. This demonstrates consumers’ strong preference for beer over spirits at this time.
- The 1986-1993 cluster: the price ratio drops significantly in 1986, giving a boost to beer’s servings. From that year forward, the pattern is similar to the 1980-1985 period, although servings are growing even faster relative to the price increases. If anything, this seems to indicate that beer’s category equity has only improved.
- 1994-2002: This is where the relationship starts to get muddled. The beer price ratio tends to decline somewhat over this period, but there is little change in beer servings versus spirits servings. In hindsight, this may be a harbinger of what’s to come.
- 2003-2020: The beer category consistently raises prices relative to the spirits category, and the impact is now almost exactly what would be predicted by basic economics. Beer no longer has quite the same equity as it had in prior periods, and so it can no longer raise price with near-impunity. In fact, the mathematical correlation between price and servings is so strong that we can actually explain beer’s declining fortunes relative to spirits in the 21st century without even bringing in the role of shifting consumer preferences. We don’t believe this to be the case; but the strength of that correlation does raise the question of whether the role of price has been understated.
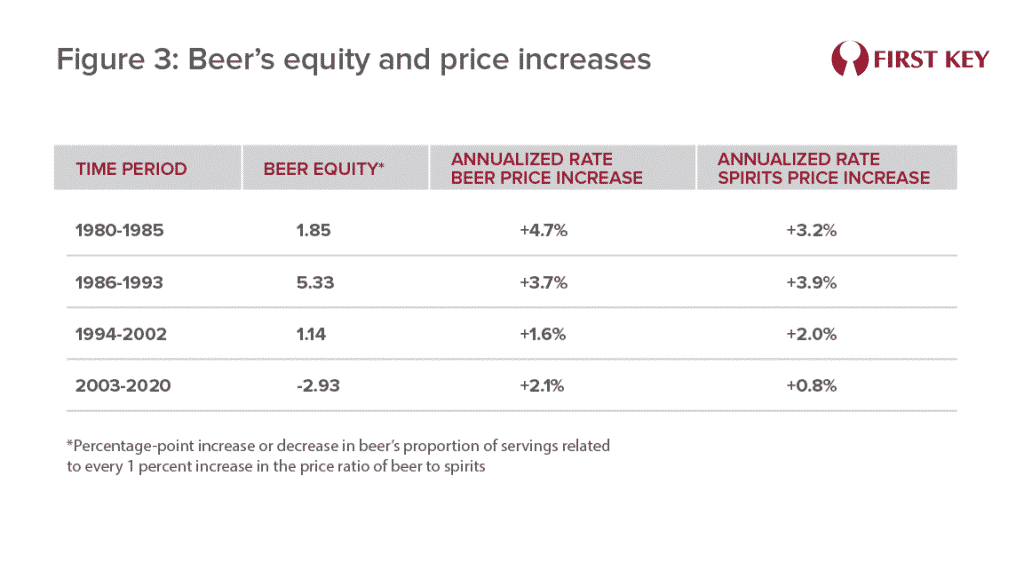
In fact, by using a simple regression analysis to fit a line within each of the four clusters of points, we can quantify the relationship between price and servings. In 1980-85, for example, the ratio of beer servings to spirits servings grew 1.85 percentage points for every 1 percentage point increase in the price ratio. We do not portray this as a causal relationship; however, we do see this as an indicator of category equity – the greater a product’s ability to increase price without hurting sales, the greater its equity. Figure 3 shows this measure for each of the four periods, along with what was happening in terms of price changes for both beer and spirits. Note that the equity measure turned negative in 2003, while beer’s annualized price increases outpaced that of spirits.
Of course, pricing decisions are not made at the category level. Most brewers and distillers set their price to be optimal in terms of gaining share from other brewers or distillers. The more aggressive pricing seen in the beer category in the 21st century may well be an indication that individual brewers believe their own brands are well-differentiated from other beer brands, allowing them to charge relatively higher prices.
That trend appears set to continue. A recent edition of Beer Business Daily reported that an informal survey of distributors found that almost six in ten felt “beer’s got pricing right – for now.” “Many talked about sagging volumes but buoyant dollars, partly due to price increases.”[3] Many brewers and distributors, to no one’s surprise, are facing challenges in hitting revenue targets for multiple reasons, including increases in costs. In such an environment it only makes sense to increase pricing. And so competition with spirits is unlikely to be front-and-center when pricing decisions are made.
Yet while individual beer brands may not be competing with any spirits brands, at least in the eyes of their owners, the net of the brewing industry’s assessment of the last 20 years makes it clear that beer does compete with spirits at some level. How that knowledge plays out in terms of a brewery’s pricing decisions will depend on each one’s individual circumstances. But it should not be ignored.
To learn more about pricing, strategy & finance, please contact us
By Mike Kallenberger
[1] The Bureau of Labor statistics publishes two sets of CPI data for each beverage, one for “at home” sales and one for “away from home” sales. For the sake of simplicity, this analysis uses only the “at home” pricing for each category Given the role of the on-premise in boosting consumer trends, incorporating that data would most likely yield a very rich analysis, but that’s beyond the scope of this article.
[2] Note also that the CPIs for both beer and spirits as published by the BLS are adjusted for the changing mix from year to year within each category, so that changes in the average price paid for each beverage capture real price increases and not the effects of trading up.
[3] Beer Business Daily, April 10, 2022