
In challenging and volatile times, companies that truly understand their processes, workflows and data tend to be most resilient. For breweries and beverage companies, gaining this understanding through process mapping can lead to quick decision-making and ultimately save money and time. Implementing meaningful changes requires a documented baseline upon which initiatives can be defined and measured. Process mapping is a fundamental tool which can be applied across all aspects of the business – from raw material ordering and management to complex processing or blending to distribution logistics. Process mapping will provide valuable insights into your business.
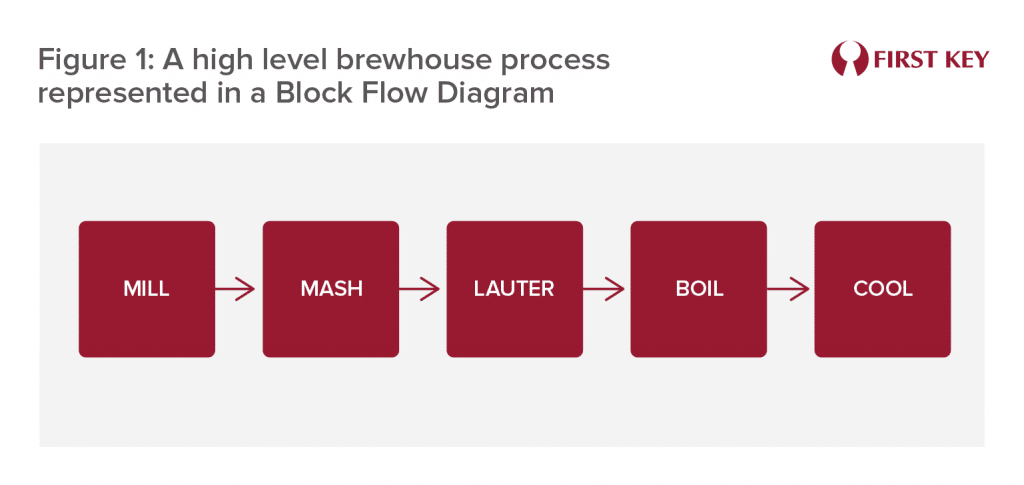
There are numerous adaptations of process maps and selecting the right one for the application is important. The most basic is the Block Flow Diagram (BFD), where a process is sketched as blocks connected by arrows to illustrate its steps and flows (Figure 1).
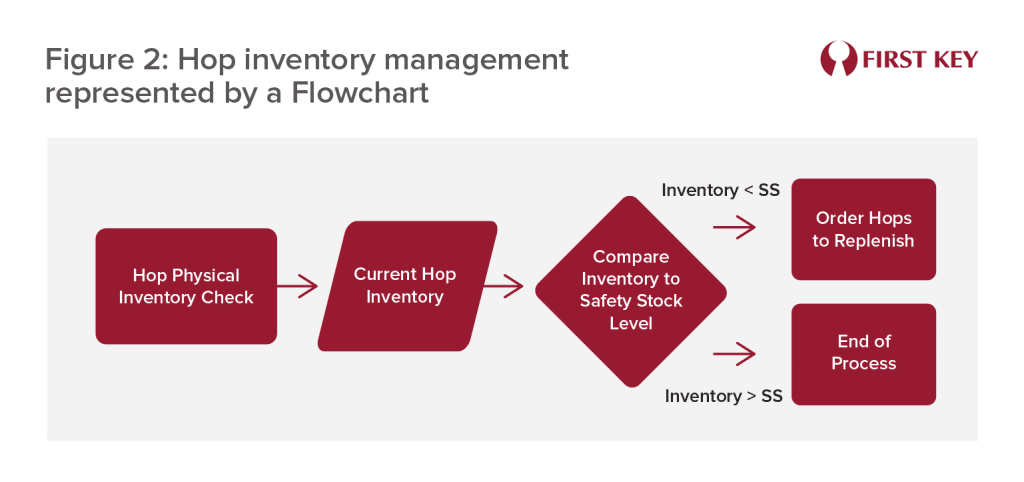
Process Flow Diagrams (PFD) or Flow Charts allow for visualization of processes and decision-making steps (Figure 2), using a series of standard symbols already included in most productivity suites like Word, Visio, Google Drawings, etc. These can be made for high-level business processes or can delve into the intricacies of turbid mashing.
Swimlane Diagrams add the extra layer of responsible parties to flowcharts which is a useful tool when various departments are involved in the success of a process. They can be used to identify bottlenecks and staffing needs.
Once operations and processes have been mapped, the “as-is” state of operations is revealed. Potential gaps materialize and opportunities for improvement become visible. Business processes like billing can now be communicated across the organization and supply processes can be fine-tuned to minimize wait times, maximize space usage, or increase efficiencies. Management can also leverage process maps to determine measurement points, define key performance indicators (KPI) and focus operational improvements on critical steps of processes.
The manufacturing world has seen several methodologies that leverage process mapping tools to assess and improve processes. Total Quality Management (TQM), Dr. W Edwards Deming’s legacy[2], is a process-centric approach to quality management that promotes iterative analysis of processes, prioritizes improvements, and leads their implementation. Dr. Deming’s approach uses process mappings in the shape of value and information maps. These tools aid in the visualization of current (as-is) and future (to-be) states of the process being analyzed. Furthermore, the mapping activity itself is an egalitarian exercise that relies on information across the organization. Successful companies that use process mapping involve and leverage the plant floor operators and technicians to truly define the real processes. The net result of process mapping is an aligned and knowledgeable organization and an engaged team that is focused on identifying opportunities for improvement and a spirit of inclusion and teamwork.
Other methodologies seek to generate operational improvement through an integrated approach. Lean Six Sigma (LSS) is comprised of waste reduction (lean manufacturing) and statistical tools to identify and control process deviations (six sigma). But a common denominator among methodologies is the use of process mapping. Scott Durnin, Senior Technical Advisor at First Key, says the act of engaging in process mapping activities can help an organization understand the cost of its operations. By process mapping the material flows and steps within a brewery, the inherent process losses of each step (e.g., dry hopping, pump and piping losses, centrifuge discharge, etc.) can be identified and quantified. It is this level of detail that makes process mapping such an essential tool. Losses may not be identified at the managerial level alone, Durnin highlights that involving brewers and technicians is the secret to ensuring the process maps accurately represent the real-world process.
Dr. Jack Buffington, Director of Supply Chain and Sustainability at First Key, says, “Process mapping leads to standard operating procedures, which lead to metrics, which lead to accountability.”
Whether operating a nano or a major brewery, repeatable recipes are a determining factor of quality. To achieve more control of operations, breweries opt for specialized software that connects critical business areas to inform business decisions (e.g. Ekos, Orchestrated Beer, etc.). These tools offer the ability to monitor and control operations from a single platform. Inventory, production, cellaring, sales, packaging, accounting, and even compliance data is aggregated in a series of interfaces designed to accomplish tasks optimally. Warehouse operators can update inventory from a tablet when a shipment is received. Brewers can update lot information to reflect recipe deviations and maintain cost transparency. Omnichannel sales can be aggregated to ensure high customer satisfaction. Brewery software has improved business operations decision-making and reduced overhead costs by automating processes.
In recent years, numerous brewery software offerings entered the market. While in principle all brewing operations have similar manufacturing processes, volume and number of SKUs are the main input variables to determine the right fit. A medium-sized craft brewery may need to prioritize connectivity to existing financial and point of sale (POS) solutions, while a nationally distributed brewery that focuses on a limited number of SKUs may need to account for highly granular process variations. Thus, large operations have distinct functionality software requirements. Furthermore, large enterprises require increased application availability and data protection. These prerequisites may tip the scale towards a long-standing software solution.
Configuration is a crucial step in implementing brewery software solutions. Many brewery ERP software solutions are based on their manufacturing counterparts (e.g., SAP, Oracle NetSuite, etc.) but are tailored to fit the business of brewing. To make a tailored product into a bespoke one, precise data must be fed into it. Process mapping exercises provide the data required for the successful configuration of the software. System integrators will typically meet with the brewery personnel to capture the necessary parameters for the solution to function correctly. However, if a brewery has already engaged in process mapping activities and knows its products and processes reliably, the bespoke solution is closer to fruition. In interviews with major brewery software providers Ekos and Orchestrated Beer (OBeer), the benefits of process mapping information to aid in the configuration were consistently confirmed. Yet, it is common that breweries seek to implement complex software solutions without previously documenting this information.
Process maps are an advantageous tool to assess current state of operations, but their usefulness depends on the quality of the data used to construct them. Involving brewery personnel with expertise in the area being mapped ensures that the actual operation is accurately reflected. The combination of hands-on experience and supervisory points of view can also reveal areas of opportunity to implement standard operating procedures (SOPs) or to document previously unknown improvements. In addition, the resulting process maps serve as training tools for beginners.
The benefits of process mapping activities and tools far exceed the level of effort required. Knowing current capabilities, process status, standardizing operations, discovering inefficiencies, training people, and lowering the effort threshold for implementing changes, are some benefits these tools provide. Furthermore, an agile organization with standard operating procedures and documented capabilities can significantly reduce the amount of time and effort required to implement brewery software. The time and resource savings in conjunction with the nimbleness for adaptation are worth the investment.
To learn more about how process mapping can lead to your brewery’s success contact us
References
[1] B. Thomas, “INDUSTRY REPORT C1121-GL Global Beer Manufacturing,” 2021. Accessed: Mar. 01, 2022. [Online]. Available: https://my-ibisworld-com.proxy.library.cornell.edu/gl/en/industry/c1121-gl/about.
[2] B. O. Ehigie and E. B. Mcandrew, “Innovation, diffusion and adoption of total quality management (TQM),” doi: 10.1108/00251740510603646.