
It’s not surprising that so much beer industry discussion has been spawned by the most recent Gallup Poll addressing Americans’ alcohol consumption. The gloomy tone of the headline (“U.S. Drinking Rate at New Low as Alcohol Concerns Surge”[i]) largely carried through into the write-up in the August piece.
A quick summary of the survey’s concerning findings: compared to prior years, fewer Americans say they have occasion to drink alcoholic beverages; the health effects of moderate drinking are increasingly seen as negative; and those who do drink report consuming less. These findings were true of all subgroups broken out in the survey.
Most of the online discussion seemed to focus on the first of these findings, probably because 54% of Americans reported drinking less, a figure that grabbed headlines as the lowest nominal rate of drinking in the poll’s almost 90-year history. The comments of alcohol beverage industry professionals tended to focus on whether and how much the industry should be concerned about this. We would characterize the consensus as “Probably some, but not as much as it might seem.” And we would agree, for reasons to be explained below.
But the number that can’t be so readily downplayed is the 25-percentage-point increase in the proportion of adults who say moderate drinking is “bad for health” in just ten years. This is arguably both the most reliable finding and the one that suggests some specific actions. More on this below as well.
The Critique
In 2022, 67% of adults in Gallup’s survey said they “have occasion to use alcoholic beverages.” That percentage then fell for three straight years, sinking to 54% in 2025. That certainly seems dramatic.
Lester Jones, Chief Economist for the National Beer Wholesalers Association, acknowledged that the numbers “signify a challenge for the industry.” But he also pointed out that the survey’s margin of error has been +/- 4 points[ii] over time, and when viewed through this lens the nominal all-time low of 54% was in fact “in the same range as 18 other surveys over the poll’s history. That’s 40% of the time that people have reported ‘statistically’ similar responses…”[iii]
Before the annual survey results for 2025 had even been published, Brewers Association President and CEO Bart Watson posted on LinkedIn “…looking forward to everyone overreacting about everything!”[iv] Once the results were out, Bart tweeted “Ignore the YoY [year on year] changes. Plug the new data points into your long-term trends spreadsheet.”[v]
One of the better analyses of the finding(s) was offered by Jeff Alworth, author of the widely respected blog Beervana. Jeff pointed out that “Some people barely drink at all – maybe once a month. If those beer-a-month drinkers go cold turkey, it’s not going to show up in the sales figures.”[vi] In the same post he pointed out that “…while sales are down, they don’t reflect the freefall measured in Gallup’s poll numbers.”
This latter is worth stressing. There’s little point in using survey data on consumption habits to assess the performance of the industry when we have actual sales data that can do a much better job of that. Assuming it tracks reasonably well with actual sales, such survey data is best used primarily to diagnose that performance, i.e., if sales are down, is it because fewer people are drinking (what market researchers would describe as declining incidence of consumption), or because those who do drink are drinking less (declining per drinker consumption)?
Not to disparage Gallup’s overall objectives or methodology, but the annual poll is simply a better tool for some tasks than others, and breaking down incidence and/or per capita consumption is not necessarily one of them. This is best illustrated by some simple calculations.
We can use Gallup’s incidence and per-drinker consumption data to calculate the average number of drinks per week claimed by all adults (including zero for non-drinkers). In Figure 1, below, we compare this to drinks per week as calculated from shipment data and population figures. [vii]
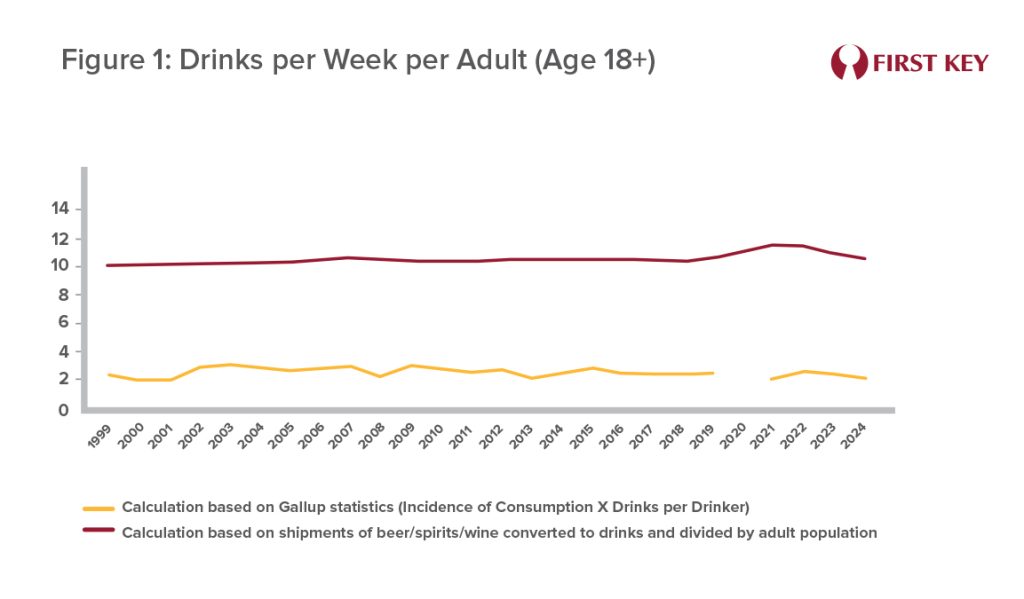
The disparity over the last 25 years between the two sets of numbers is striking. According to Gallup’s numbers, adult Americans have consistently reported consuming an average of 2-3 drinks per week. The “actual” figure is much closer to 11 drinks per week. This is a strong indication that, the Gallup study’s strengths aside, respondents are simply not providing reliable information regarding their drinking behavior.[i]
Some Context for Interpreting the Survey Findings
Market researchers love to sort findings from respondents into categories like motivations, behavior, and beliefs. But they also acknowledge that getting accurate reads on some of these can be more challenging than others. Gauging motivations, for example, is often particularly frustrating; it’s not that people simply misrepresent their motivations (which happens often enough) but that in many cases they’re literally unaware of the largely unconscious reasons they make the choices they do.
When Jeff Alworth says that “…there’s some evidence that people answer survey questions aspirationally rather than accurately” he’s specifically alluding to one type of problem encountered in trying to measure behavior.[ii] Are people deliberately fudging on how often or how much they drink? It doesn’t really matter if they’re fooling others or fooling themselves, but yes, what they say they do can be distorted by what they wish to be true about their behavior.
If self-reported motivations or behavior are occasionally subject to unconscious bias, survey responses regarding beliefs are likely to be closer to reality. Such questions are less likely to require the respondent to do any deep reflection or even remember what they did last week, and they’re also less likely to produce any “aspiration bias.” People often actively enjoy sharing what they honestly believe. (This is why so many survey pitches open with “We’d like to ask about your opinions today.” People would be much less likely to participate if solicited with “We’d like to ask you about your motivations and behavior today.”)
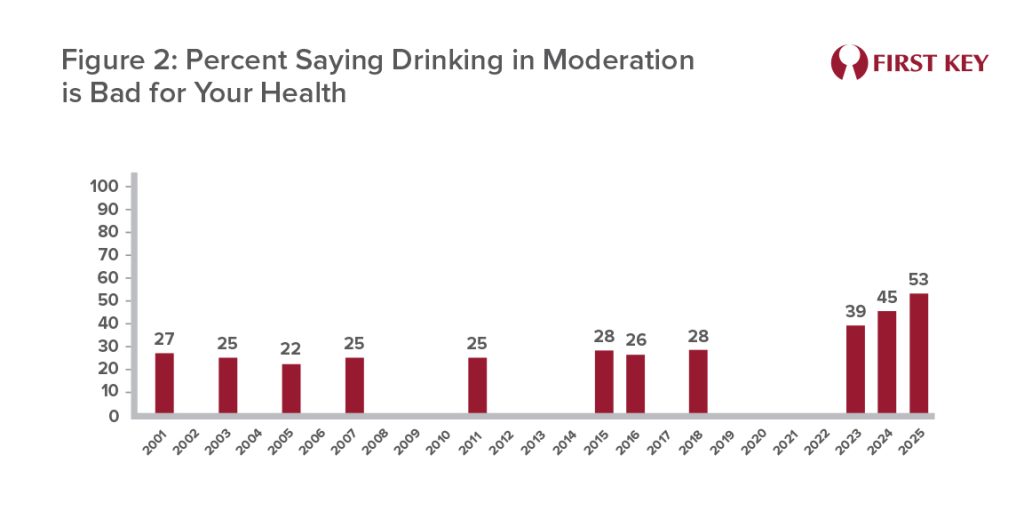
That’s why the answers over time to Gallup’s lone (reported) question about a belief are likely to be the most reliable, and therefore the one to be most concerned about: Do you, personally, think drinking in moderation – that is, one or two drinks a day – is good for your health, makes no difference or is bad for your health? As Figure 2 shows, roughly a quarter of all surveyed adults believed this over the 2001-2018 period. The question wasn’t asked from 2019 to 2022, but when it was restored to the questionnaire in 2023 the percent expressing a belief that drinking in moderation is unhealthy hit 39%, and grew to 53% in 2025.
Whether or not the decline in incidence and per capita consumption is currently real or largely aspirational, it may well become realer in the near future if health concerns related to alcohol continue to spread. This article will not take a stand on the conflicting reports about the degree of risk related to moderate drinking. However, we feel the beer, spirits, and wine industries would at minimum be well-served by significantly upping their investments in promoting the documented social benefits of drinking.[i] These benefits have been familiar for almost as long as beer has existed, and they shouldn’t be forgotten now.
[i] https://news.gallup.com/poll/693362/drinking-rate-new-low-alcohol-concerns-surge.aspx
[ii] Those who are statistically inclined may want to know that this margin of error relates to a 99% confidence interval
[iii] https://www.linkedin.com/in/lester-jones-nbwa/recent-activity/all/
[iv] https://www.linkedin.com/posts/bart-watson-09255a36_we-should-be-getting-a-new-version-of-gallups-activity-7361049221573042176-SXG9/
[v]https://x.com/BrewersStats/status/1428385826874945538
[vi] https://www.beervanablog.com/beervana/2025/8/19/gallup-may-be-premature
[vii] We calculated drinks-per-week by converting actual shipments of beer, wine, and spirits to the number of drinks represented by each and dividing it by the total population of adults, with adults defined as 18+ to stay consistent with Gallup’s approach.
[viii]There are three ways in which the shipment-based calculation is itself less than perfect: it overstates per-capita consumption by an unknown amount because some of those drinks were likely consumed by those under age 18; the amount shipped in a calendar year is not exactly the same as the amount consumed, as distributor and retailer inventories fluctuate; and the conventional definition of a drink (12 ounces of beer, 1.5 ounces of spirits, 5 ounces of wine) may not be an accurate estimate of the size of all drinks. But the latter two sources of error are essentially trivial for our purposes. As for underage drinking, it would certainly affect the calculation by a bit, but there’s simply no way it can account for 8 or more out of every 11 drinks consumed.
[ix] https://www.beervanablog.com/beervana/2025/8/19/gallup-may-be-premature
[x] See, for example, https://www.ox.ac.uk/news/2017-01-06-your-health-benefits-social-drinking