
According to the US based Brewers Association (BA), “changing consumer behaviors, cost increases due to inflation and tariffs, and more competition than ever have been compounding difficulties in 2025.” 1 New brewery openings have decreased for consecutive years, while the brewery closing rate increased. Inflationary pressures have driven increases in the costs of ingredients, packaging supplies, utilities, labor, freight, etc. Meanwhile, volume growth has become harder to come by amidst increased competition, leading to pricing pressures. The brewery’s survival and long-term growth depend on its ability to achieve and sustain the necessary level of profitability. In this brief review, we will highlight some of the key factors that impact profitability, and ideas on how to improve profitability, without impacting quality.
Profitability Metrics
To begin, let’s define the profitability metrics we will use: Gross Profit/bbl, and Gross Profit Margin.
Gross Profit/bbl = Revenue/bbl – COGS/bbl
Gross Profit Margin = (Revenue – Cost of Goods Sold)/Revenue
It is valuable information to calculate these metrics as a total for the entire brewery but also very insightful to calculate for each brand and SKU. Since brands and SKUs have variations in Revenue and Cost, the more detailed your data, the better it will be to assess the issues and allow for the formulation of clearer actions to improve profitability.
Understanding the Cost Structure
To calculate COGS, we need information (for each brand) for:
- Ingredient costs (e.g., malt, adjuncts, yeast, CO2)
- Packaging materials costs (e.g. bottles, cans, carriers, cases)
- Utilities costs (e.g., gas, electricity, water)
- Labor costs.
It is very helpful to develop a process map chart showing these various cost components. The chart helps not only to visualize the various components to the total COGS, but it also serves as an aid for brainstorming opportunities for cost reduction.
Critically evaluating where cost is added to each brand and SKU is a valuable exercise to identify profitability challenges and/or opportunities. Often, there are hidden costs or underutilized resources in parts of the process which don’t show themselves as clearly when looking at the total brewery level.
An example of this is Labor costs. Labor costs can be assigned proportionally to the volume of each brand produced, while accounting for particular differences. Brands that have less steps or processing should yield more profitable brands – if they aren’t it is important to evaluate why!
Assigned costs to specific brands and SKUs help to define specific costs for these brands or SKUs which can then be compared to the revenue they generate. For instance, dry hop labor costs would not be charged to recipes that do not involve dry hopping. Similarly, labor costs associated with kegging would only apply to brands that are kegged.
For Revenue, we need the pricing and the volume sold for each brand and SKU. We will talk more about pricing later. It is also important to segregate revenue by strategic business unit where there is more than one way to sell your beer – for instance distribution through wholesalers, self-distribution, sales through owned taprooms or brew pubs, and contract production.
A Craft Brewery Example
Let us illustrate what we discussed thus far with the following case involving a craft brewery which currently produces five brands. The following table summarizes some key figures.
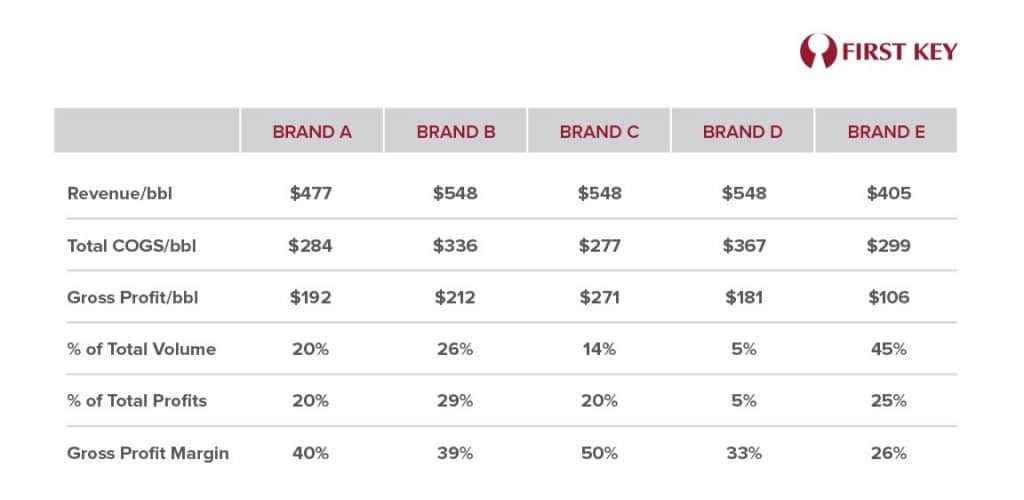
We see that all brands are profitable, but there are some significant differences. Brand E has the lowest profitability per barrel, which is only about half of the profitability per barrel of the other brands. Yet, Brand E accounts for almost half of the volume that the brewery produces. Even though it accounts for 45% of the total volume sold, it contributes 25% of the total profit. Its revenue per barrel is 15 to 25% lower than the other brands, while its COGS is only about 5% lower than the average COGS for the other brands. The Gross Profit Margin of Brand E is about half of Brand C’s, for instance.
Brand E illustrates a case where some focused effort needs to be made to review its pricing strategy and look into opportunities for COGS reduction. In terms of pricing, the brewery has the option to lower its price and further enhance volume, or to keep the current price and focus on improving profitability. If Brand E is indeed a volume play at lower margins, the opportunity to look for even greater margins in Brands A to D becomes very important. This essentially would be the case of having one brand with an everyday low price strategy supported by high margin brands to give the business an acceptable margin.
Possible areas to investigate that might help us drive reduction in COGS/bbl include: reducing yield losses that might stem from dry hopping; looking for an alternative provider of a high-cost ingredient; reducing beer losses caused by frequent product changes in packaging; avoiding product losses due to obsolescence; improving yeast repitching practices to reduce yeast purchases, etc.
One needs to be careful with pricing and recipe changes as Brand E represents such a high contributor to the total volume. Performing test brews with recipe changes and ensuring a close flavor match, for instance, will be important.
As Scott Durnin from First Key points out, “working through this analysis with the brewery’s team is important. Not only will it result in more accurate COGS estimates, for instance, but it will also help to generate ideas for improvement”. One example with one of our clients involved the case where labor in the brewery was maxed out during the peak months but had idle hours during the rest of the year. Deploying personnel from the taproom to the brewery, and vice-versa, enabled the client to not only better utilize its resources, but also resulted in better teamwork and employee growth opportunities.
In assessing COGS reduction opportunities, it is important to look at all brands and SKUs. Just because the margin of a particular brand or SKU is high relative to other brands, it does not mean that cost reduction opportunities do not exist.
A few comments on Pricing
A key factor that drives revenue is pricing. There are various approaches to setting pricing, such as:
- Pricing versus competition. This evolves over time and there are many influencing factors.
- Setting a margin over the SKU’s COGS. In other words, setting pricing such that one ensures there will be a profit margin that is at least greater than a particular threshold.
- Customer affordability, i.e., finding out what consumers are willing to pay for a particular SKU.
- The strategic role of the SKU or brand. For instance, the brewer may be willing to live with a lower margin on a product that helps attract consumers to their brewpub, in the hope that the consumer will also order other brands and/or food from the pub.
When the product is sold through a distributor (wholesaler) and a retailer, the brewer needs to account for the margins that the wholesaler and retailer will expect.
Other important opportunities
The initial outcome of this cost and profitability analysis should ideally be further leveraged in the following ways: setting cost standards, tracking results over time, and adopting profitability analysis as part of any new product development launch.
Tracking results should be done on a set frequency basis, monthly if possible, or at least quarterly, comparing actual results for that month or quarter vs. the cost standards previously established. This enables the brewery to understand, for instance, the impact of seasonality on profitability: we may see lower than anticipated COGS/bbl during peak months than what was originally found, and this may generate ideas for improvement during the off-peak months. Tracking may also help to identify and highlight unforeseen issues (e.g., product losses due to a batch that was quality defective) and with that, ensure that preventive or corrective actions are in place to prevent future occurrences. Tracking may also help to identify improvement areas (e.g., reduced beer loss in the cellars) and with that, taking steps to ensure that those improvements can be sustained.
Incorporating profitability analysis as part of the new product development process is also important to ensure that new product offerings will help, not hinder, the brewery’s profitability. This is particularly important as some ingredients (e.g., flavoring sources) may add significant cost, or for situations where the recipe may inherently have yield losses that are higher than the current products. “This is not to restrict creativity in recipe development but to ensure that a great recipe will benefit the financial performance of the brewery in a long lasting, sustainable way” says Dr. Hugo Patiño from First Key.
Profitability analysis need not be a complex exercise that is only applicable to large brewers. Some of our clients are craft brewers and have successfully incorporated this approach into their operation, enabling them to grow not only in volume but in the profit margin. Recipe costing and disciplined management can be a powerful tool for improving performance regardless of the size of the brewery.
To find out more about our Performance Improvement Program please contact us
1.https://www.brewersassociation.org/association-news/the-2025-year-in-beer/