
Anyone close to the craft beer business knows what’s been happening in recent years. The most recent pivotal year for craft beer growth was 2016, when the annual rate of increase “crashed” to 0.4%[i] after averaging 14% yearly growth for the past ten years. Growth in 2017 and 2018 was only marginally better. To the dismay of many in the industry, however, new breweries continued to open at a surging rate, causing almost everyone to wonder if there’s going to be enough consumer demand for beer to go around or if a shakeout is inevitable.
Some would characterize the unrelenting growth in numbers of new breweries since 2016 as irrational exuberance, clearly unwarranted after the collective experience of that year. But a deeper analysis of the data yields some additional perspective. And so if the question is “Do we have too many breweries?” our short answer is “Probably. But…”
It looks as though expectations are finally falling back toward reality at the same time that reality is catching up to expectations.
The Brewers Association website provides annual data on the number of breweries by type along with the total production of each type. Figure 1 shows a simple calculation of the average production for each type of brewery over the years 2004 to 2018. This sort of average is in many ways mixing apples and oranges (and even watermelons), but it does give one indication of whether there’s enough beer demand to go around.
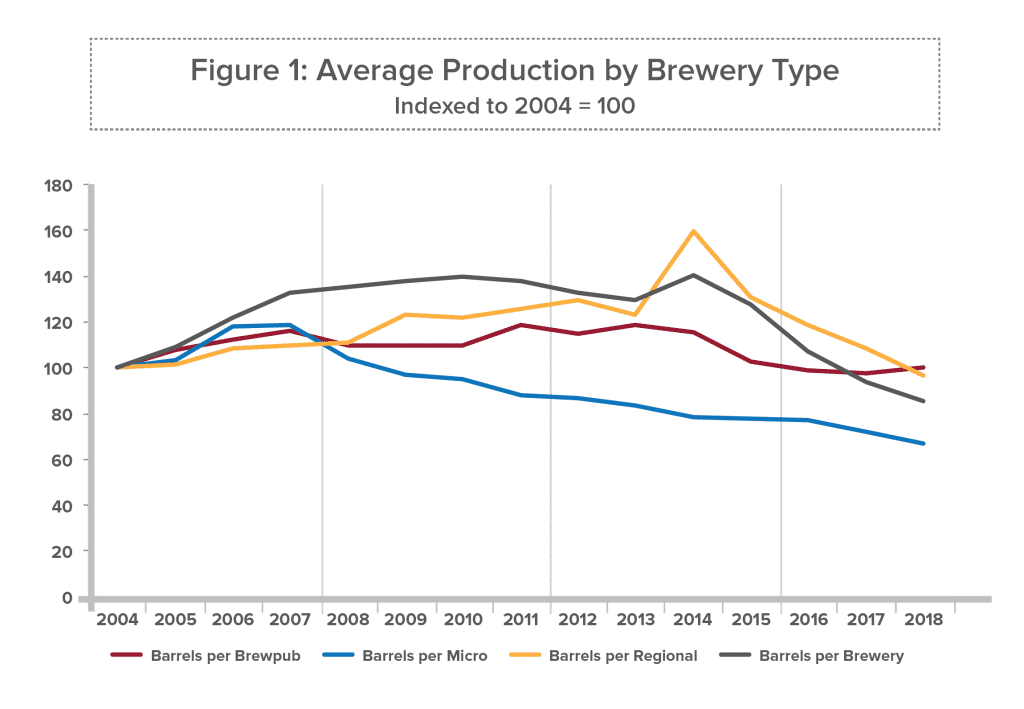
No surprise: since 2015 the average annual production for all craft brewers (the black line in Figure 1) has declined, and each of the three major brewery types tracked by the BA (brewpubs, microbreweries, and regional craft brewers) has contributed to that decline. But the overall average conceals some interesting dynamics. Microbreweries have in fact been seeing their average barrelage decline since 2007, almost a decade before the current flattening of craft volume growth. The volume per brewery for total craft was flat from 2007 to 2014 only because of continued growth in volume-per-brewery among regionals and brewpubs, offsetting the declines in micros. Then in 2014-15 the growth for regionals hit the wall, sending the regional average down and pulling the overall average down along with it. However, during that same period the volume per brewpub has stabilized, essentially flat since 2016.
Figure 2A shows a graph that provides some good context for this discussion of brewery growth and irrational exuberance. The horizontal axis shows the year-to-year growth in total brewpub production for each year from 2005 through 2014 and the vertical axis shows the number of new brewpubs for the same years.[ii] There’s a strong correlation between the two, as indicated by the fitted line. (The R2, a statistical measure of how close the fitted regression line is to the actual data, is 75%. An R2 of 100% would equal a perfect fit to the data.)
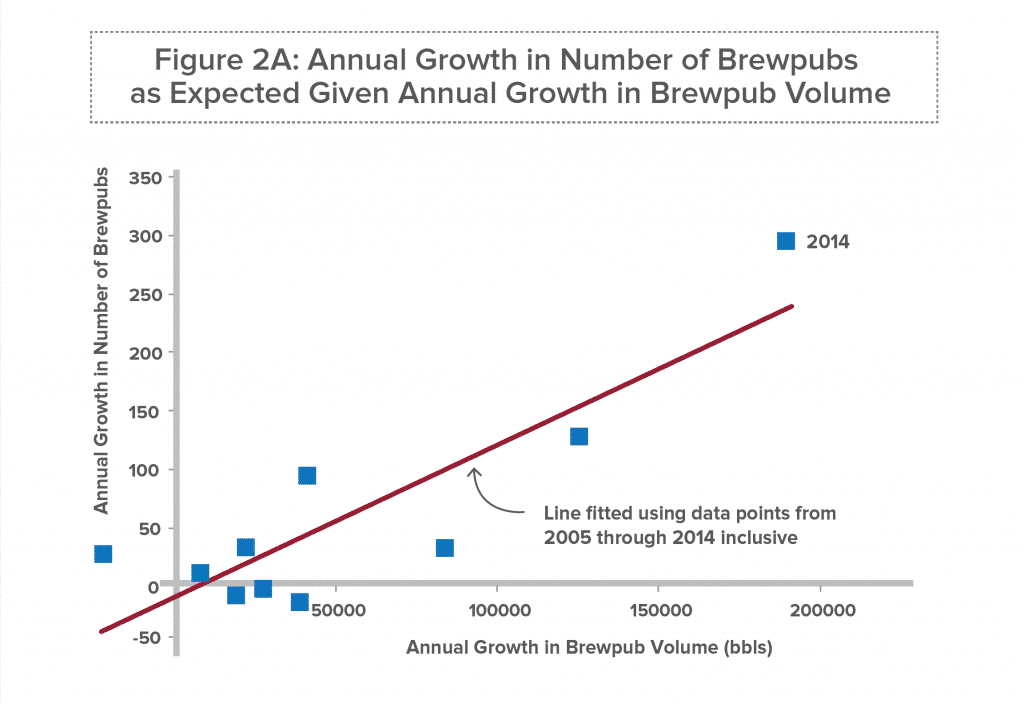
This can be interpreted in two ways, complementary to one another. First, at least through 2014 the market added new brewpubs at a disciplined rate, with consumer demand growing just fast enough to keep up with the number of new establishments.
Second, the growing demand for brewpub-produced beer could be seen as a mathematical driver of the growth of new brewpubs. In other words, the correlation noted in the previous paragraph isn’t just a fortunate coincidence, but in fact here correlation does equal causality.
How and why? Presumably the decision to start a new brewery is based on many factors, but the first and foremost is likely to be “There’s enough business to go around.” And whether or not that belief is based on a market analysis or intuition, the primary input is likely to be “How fast is the pie growing right now?” The collective intelligence of the market was arguably driving the expanding list of brewpubs in order to meet demand.
But after 2014 this statistical relationship more or less fell apart (See Figure 2B). The data point marked 2015 shows that brewpubs openings up to that point, were second only to 2014’s, despite growth in brewpub volume that was less than 10% of what it had been in 2014. The market was essentially betting on continued brewpub volume growth, and it didn’t happen. In 2016 and 2017 the situation was better, but still not good; brewpub volume growth had accelerated somewhat, but there were still more new brewpubs than could be justified based on the prior pattern (i.e., the fitted line).
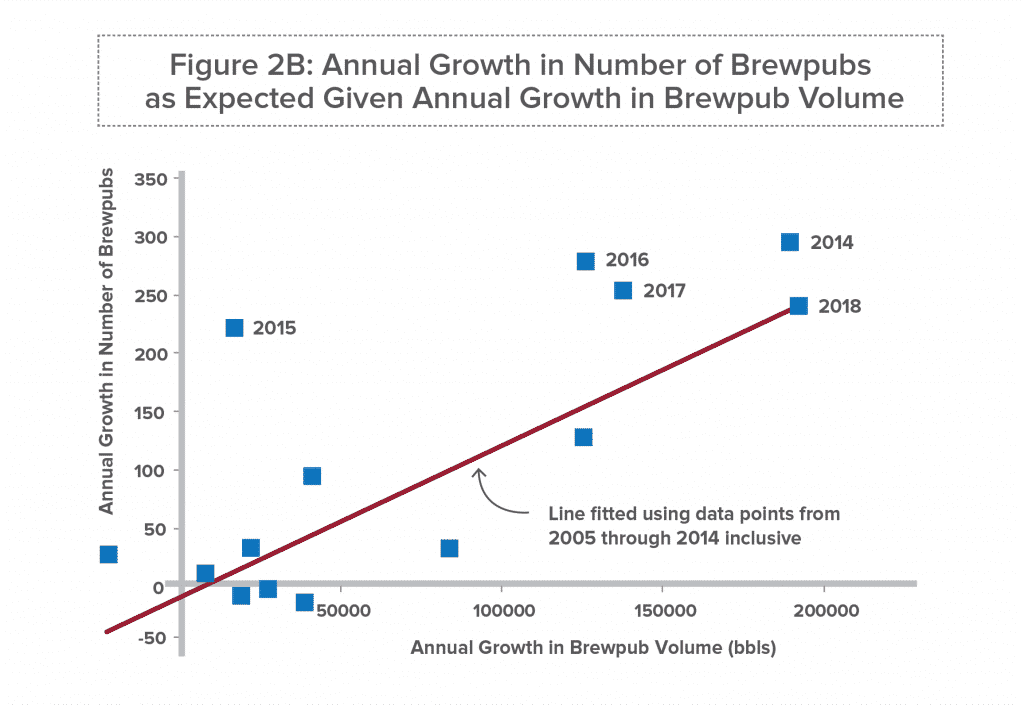
Then, in 2018, a funny thing happened. Would-be brewpub founders continued to open new brewpubs, although at a slightly slower pace than in 2016 and 2017 – even as the annual growth in brewpub volume hit an all-time high.
After three years of trial and error the number of new brewpubs in 2018 turned out to be “just right” for the market that year. The market, it seems, may be a slow learner, but it does learn. Expectations fell back – all the way back to reality, but partly because reality was catching up to expectations.
Now let’s look at the results of a similar exercise for microbreweries. (For various reasons regional craft breweries don’t lend themselves to this sort of analysis).
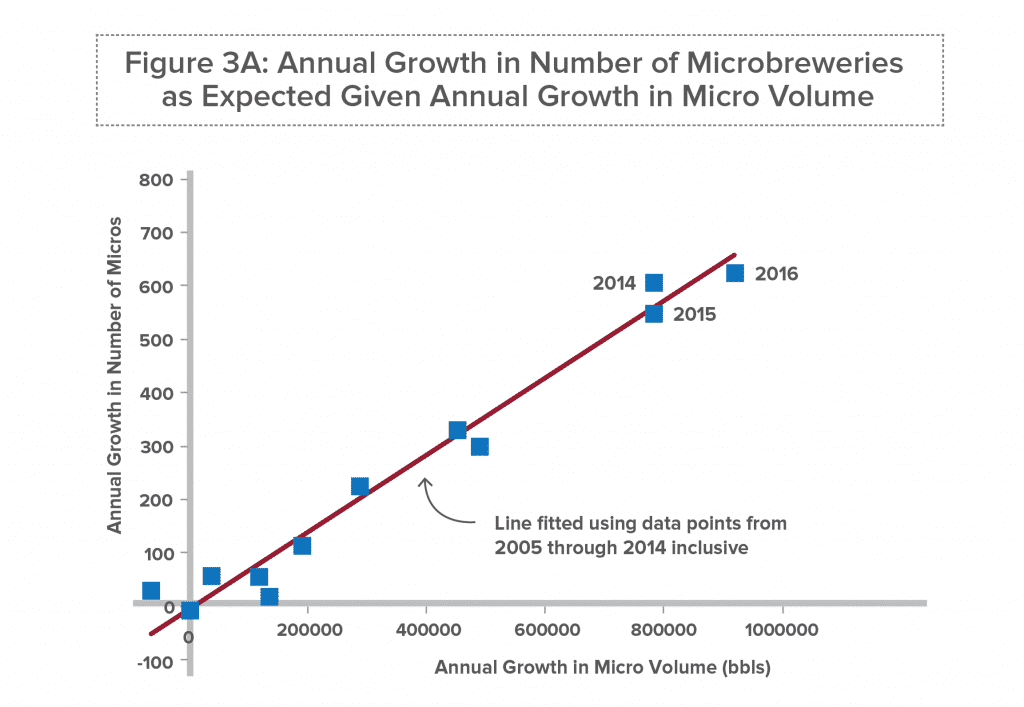
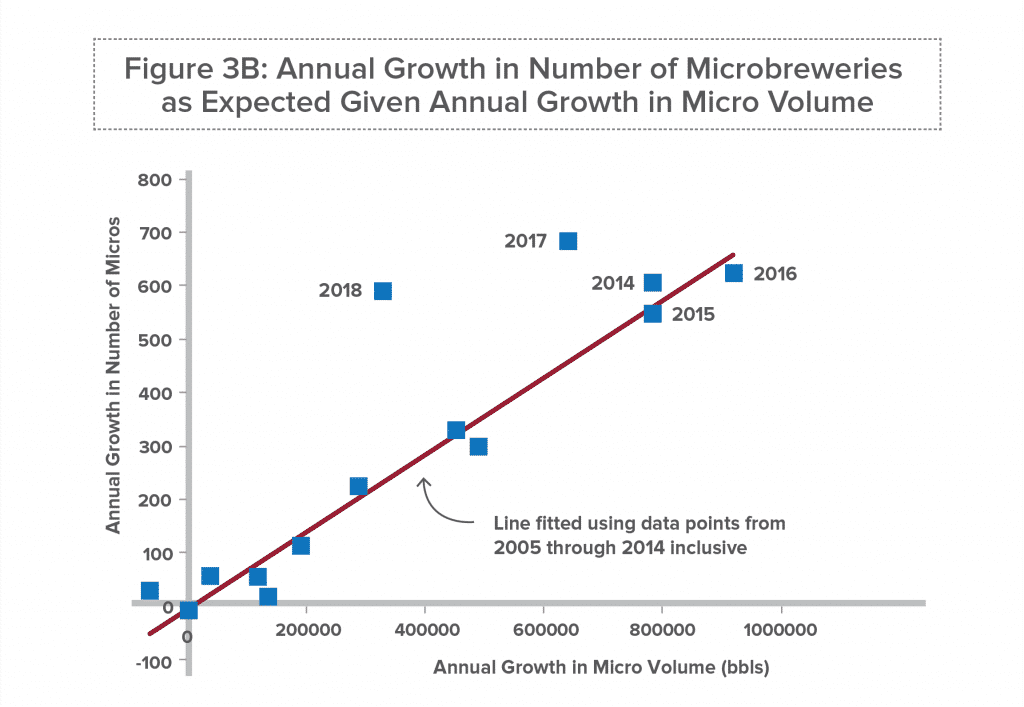
Here the line was likewise fitted only through 2014, and the correlation is even stronger – an R2 of 94%. Yet in 2015 and 2016 the production of microbreweries continued to accelerate and number of incremental breweries in those years was exactly right given that acceleration. The growing number of microbreweries was essentially tracking consumer demand for their products for two years longer than we’ve seen in the case of brewpubs.
But eventually – 2017 to be precise – reality caught up with the microbrewery segment as well. The year 2017 saw the largest annual increase ever in terms of micros, and 2018 saw only a small pullback, despite the fact that consumer demand for micro-produced beer fell off sharply in both years. If it takes the collective wisdom of the microbrewery market three-years to finally “learn” how fast their numbers should actually grow in the face of consumer demand, we may not see a convergence of expectations and reality until 2020. But we tend to think the micro market will respond more quickly if only because it’s benefitted from observing the brewpub market’s ultimate eventual alignment.
But keep in mind that alignment depended in part on the demand for brewpub-produced beer to start growing again. Can we assume any category growth for the next few years, for either brewpubs or micros?
The preliminary news for 2019 is heartening. In his August 6th posting “Analyzing 2019 Midyear Craft Brewing Growth” on the BA website, staff economist Bart Watson analyzed some data for the first half of this year and concluded “…micros and brewpubs that responded [to the BA survey] are actually growing slightly faster than their 2018 numbers… A slightly lower percentage of breweries reported growth than we saw in this sample for full-year 2018. However, the vast majority are growing, and many at rates stronger than they saw in 2018.”[iii] (Emphasis ours.)
If craft beer growth really does continue to improve, we feel it’s reasonable to anticipate a continued long-term convergence of expectations and reality – one that may be less dependent on any kind of shakeout than a need for a couple years of patience on the part of the craft brewing community.
To learn more about market research & projections, please contact us
[i] The exact figure depends on how craft is defined. This article is using figures from the Brewers Association aggregating the total production of brewpubs, microbreweries, regional craft brewers, and contract brewers.
[ii] Technically this is net growth, openings minus closings, but let’s just call it “new” brewpubs for the sake of simplicity.
[iii] https://www.brewersassociation.org/insights/analyzing-midyear-craft-brewing-growth/